
My engine has supported Metal for a long time, but I haven't really optimised the Metal renderer before. In this post I go through the process of optimizing Sponza scene with 2048 dynamic point lights from non-interactive frame rates to 60 FPS on an iPad Pro 10.5". I learned a lot and wanted to share my learnings.
Apple's profiling tools
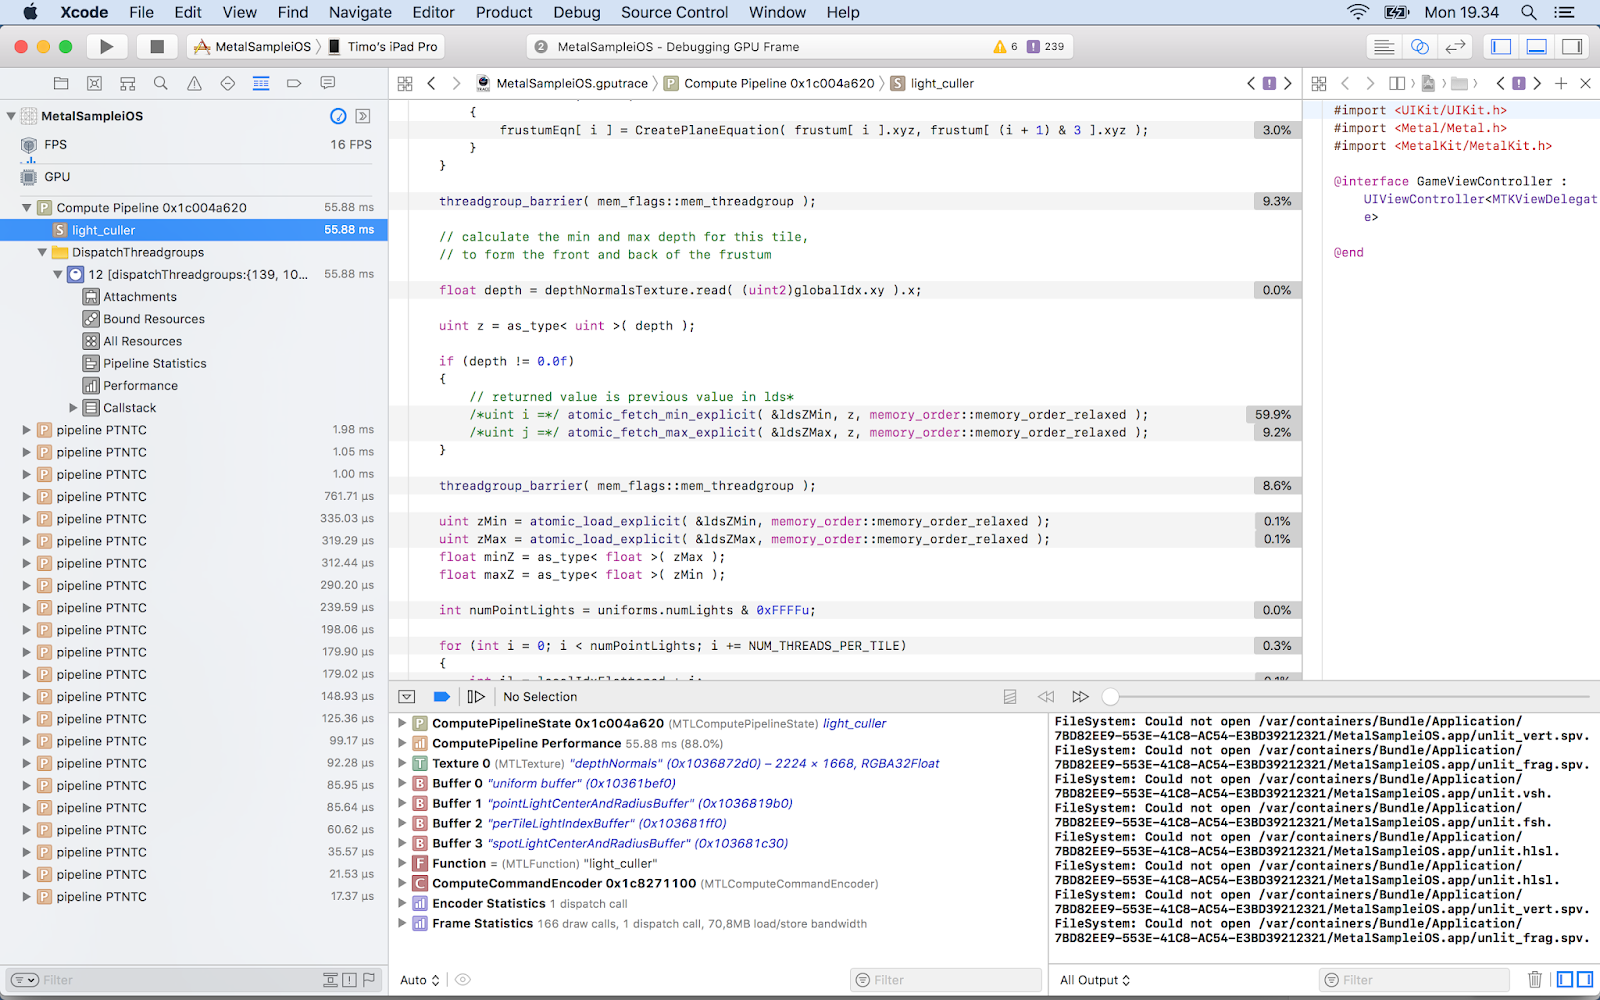
I started my optimisation journey by taking a GPU frame capture in Xcode. Right away I saw that Apple has added a lot of useful features that were missing or less informative in the past. I was delighted to see that it now has GPU counters, timings on source lines and optimisation tips ("Remarks"). Setting a conditional breakpoint to capture a GPU frame at a fixed frame number got me slightly more consistent results than randomly pressing the capture button. A very good feature is the ability to edit a shader during the capture and see the results without restarting. Xcode and its associated tools are still buggy and crash often. I also often got an annoying "No capture boundary detected" error.Initial capture

Optimization
What if I don't use depth bounds? Light culling now takes 13.53 ms and 2 234 827 000 ALUs, and I already got 60 FPS. But let's not stop here! I watched the excellent WWDC 2016 talk Advanced Metal Shader Optimization . Xcode's Remarks section warned about buffer preloading. I tried to fix them but couldn't find a way. My first optimisation was to provide the horizontal and vertical tile counts as uniforms instead of calculating them in the shader. Percentage for those code lines decreased from 1.8 % to 1.4 % and ALU from 2 234 819 000 to 2 208 126 000. The WWDC video suggested to use shorts instead of ints: 2 205 648 000 ALUs.
Future
There's a lot of room for improving the results further, and it's needed. I didn't focus on my material shader in this post because my current engine's shading model is not yet physically based unike my old engine's and I'm not using post processing effects. I use floats in many places where a half would do. I also don't use texture compression, but my engine already supports ASTC so it's just a matter of encoding Sponza textures. My light culler could use parallel reduction or clustered culling.
Metal 2 has some features that could help, like tile shading, function specialization, resource heaps and argument buffers. My plan is to study them next, the concepts are already familiar to me from other graphics APIs. The engine is open source and can be downloaded from GitHub.
